SignalFx
Table of Contents
- Introduction
- Saving and Importing
- Unarchiving metrics
- Alerts and Detectors
- Translating queries from Grafana to SignalFx
- O11y I2 (CBS)
- Miscellaneous
Introduction
All of our dashboards and alerts exist in a platform called SignalFx under the team name 'pst':
- DEV (for NXT and QA)
- PRD (for DRK and PRD)
The metrics come from different places, like Prometheus, Cloudwatch (AWS) or custom collectors, depending on the TLA and metric.
Observability documentation
To explore the raw data from Prometheus, you can visit the Prometheus endpoint, for example: https://bcg-service-prdpp.platformservices-prod.aws.private/actuator/prometheus
Saving and Importing
All our changes are persisted in the Observability Github repository, under the team folder 'pst'.
Any changes made and saved on the UI are temporary and will be deleted once there is a redeployment in our team space (for example when a PR is merged).
This means we need to save the UI changes in our entities (dashboards and detectors) as code by importing them using the following
Github Actions.
Running this job will create a PR, which will be common for any changes in our team, this means that any new changes
imported will be added there, as we can only have one PR per team at a time.
You will need to ask O11y team to merge it once ready (#uki-observability-support).
IMPORTANT: Please mark the PR as Draft whilst adding things to it or if several people are working on O11y at the same time, otherwise it may
be automatically merged and people will lose any changes not imported.
STEPS:
1. Check if a PR is already created, if so, your changes will be added there.
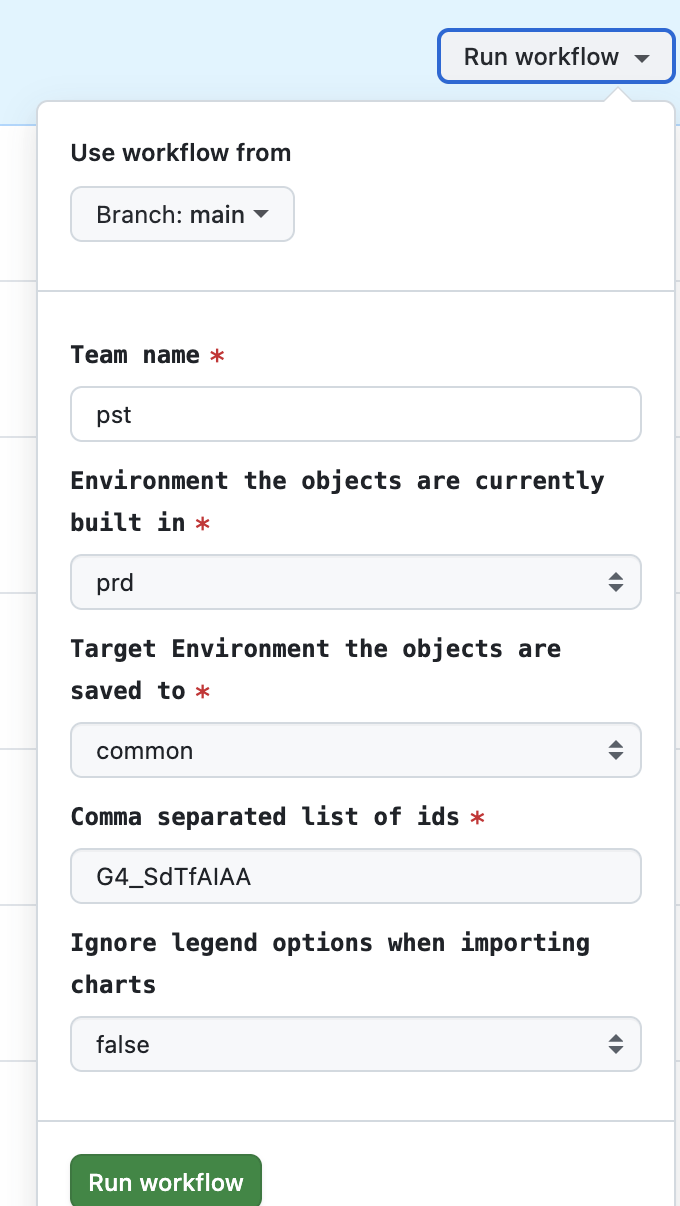
2. Go to the O11y Github Actions and use team “pst”.
Select the environment your changes are built in the UI, then select the environment you want to save them to (the environment should always be common).
Add the dashboard or detector ID (first ID in the URL as per the image below). Once the job has run and a PR is created, make sure to mark it as DRAFT so that it is not merged automatically.
3. Before merging a PR, please check with other team members so they don’t lose any changes.
4. Once ready, mark the PR as "ready for review" and ask the observability team to merge it on #uki-observability-support

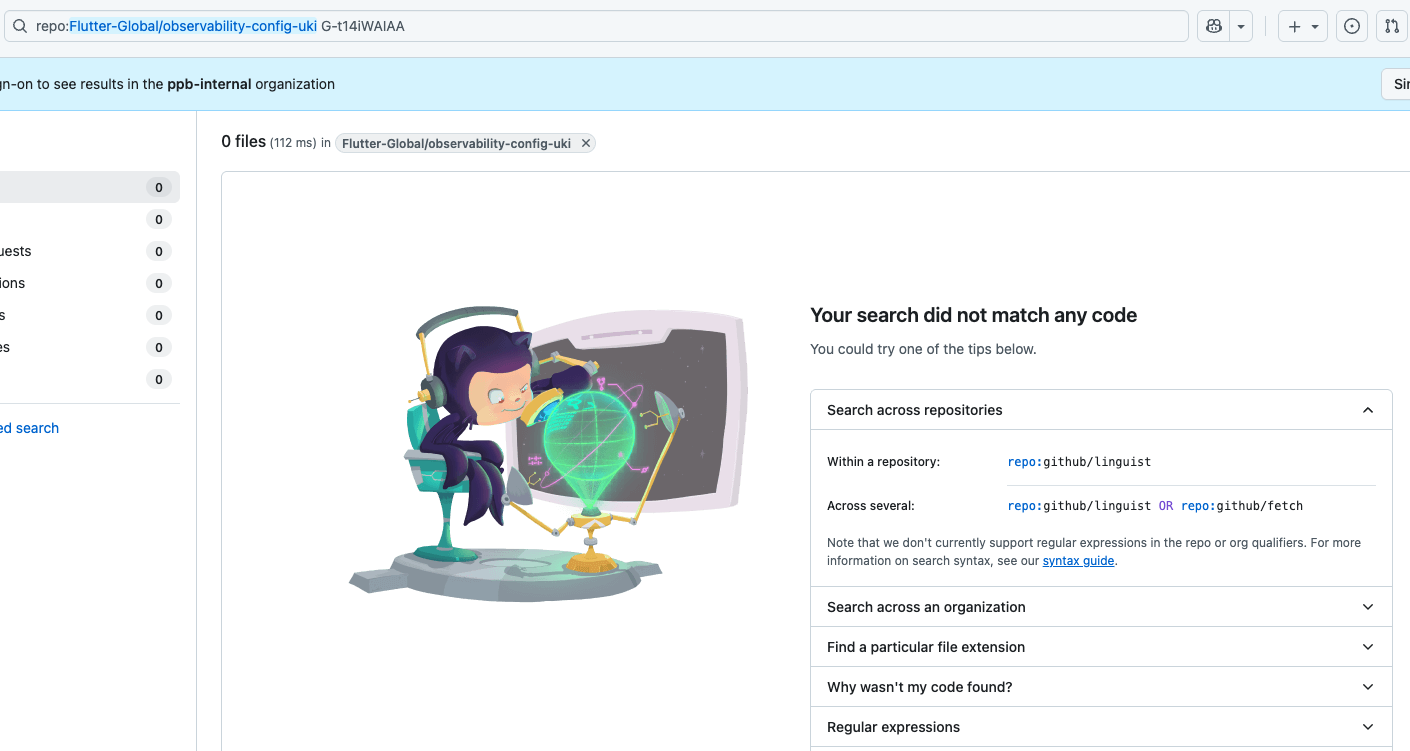
Unarchiving metrics
Sometimes, when creating a chart or alert, you may notice that a metric has been marked as archived. This can happen if the metric
hasn't been used for 30 days or more. To unarchive metrics, they need to be added to the following file
If the metric is already in the file and you see something like this:
Alerts and Detectors
All our alerts need to be grouped by Detectors. To the point of writing this documentation, it was not clear from O11y's side
what entities these detectors should cover (some team have grouped them per team or per TLA, others by technology). What we know
is that we have a limited number of detectors and should try to reuse alerts for different TLAs where possible. In our case,
this meant for example grouping TIM and DEC in a single "Flink Detector".
In order to create a Detector, you can press the top right "+" sign and "Custom Detector", then you will be prompted to create
at least one alert for that detector.
Please note that when creating and alert, all queries for all the alerts in that detector will appear in the same screen. You
will need to select the query that is relevant for the particular alert (see image below).
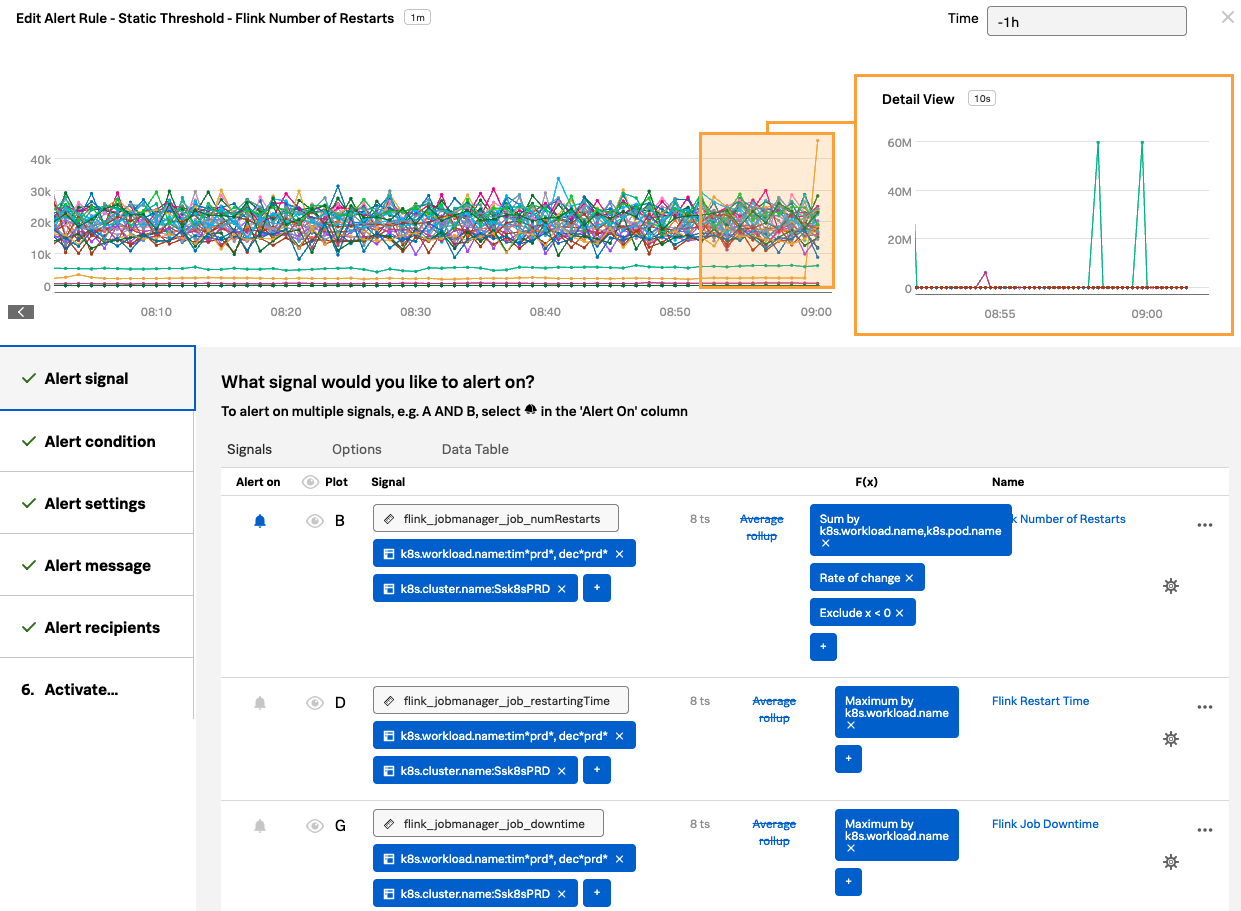
Make sure to filter the queries appropriately, for example, in the above image, we made sure it is only looking at TIM and DEC in PRD by adding filters to the Signal section. Also, make sure the functions are added correctly, as this will massively change the numbers we get and the times we will be alerted.
Translating queries from Grafana to SignalFx
-
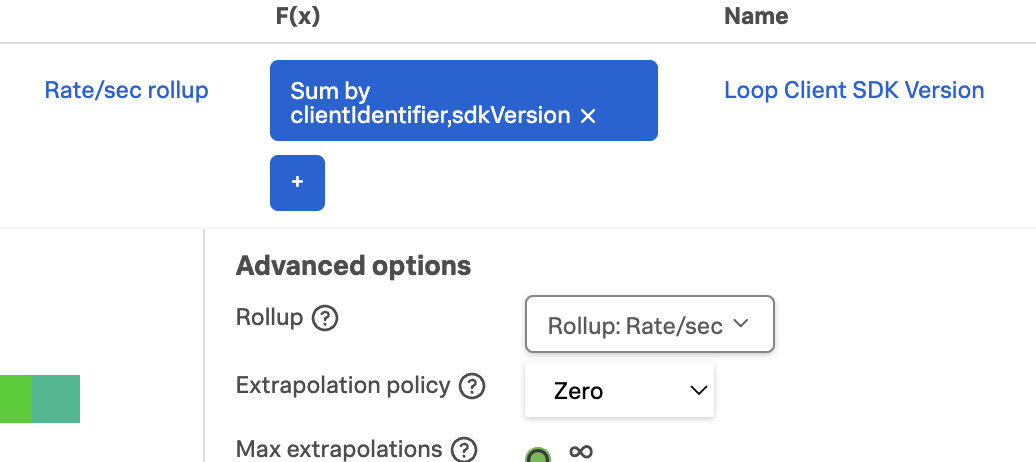
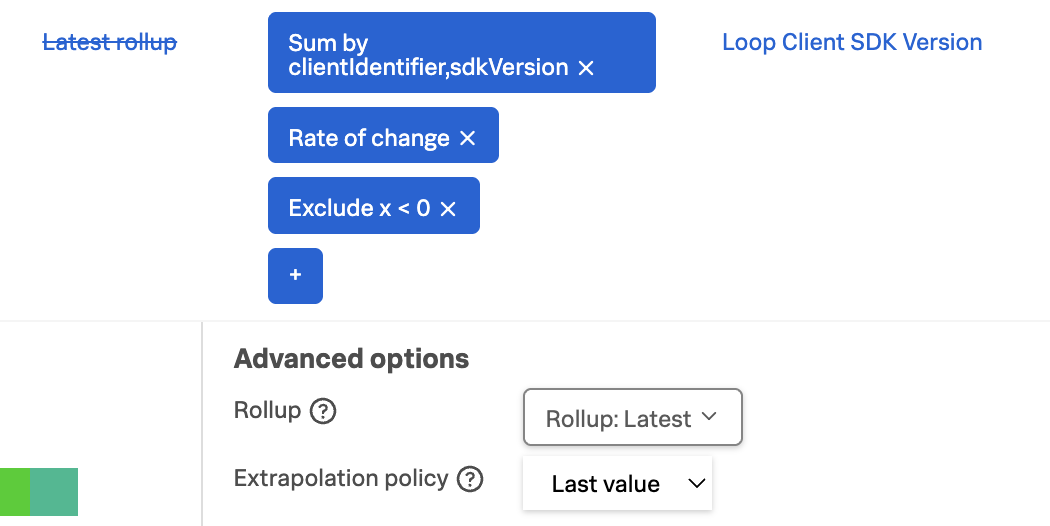
Grafana’s Rate is normally equivalent to either a “rate/sec” rollout OR “Rate of Change” function + “Exclude < 0” Function + “Latest” rollup + “Last” extrapolation function (you can change rollout and extrapolation when you press the cog next to a query). Below you can see two ways of doing the same thing for Grafana’s Rate function in SignalFx (best to use the rollout when available)
-
Grafana’s Increase is normally equivalent to either a “delta” rollout OR “Delta” function + “Exclude < 0” Function + “Latest” rollup + “Zero” extrapolation function. Below are the two ways of doing the same in SignalFx (best to use the rollout when available):
-
Grafana's Drop Non-numeric Values → Null Extrapolation policy in SignalFx
- Grafana's Replace Non-numeric Values → Zero extrapolation policy in SignalFx
O11y I2 (CBS)
- Config Repo has the otel collectors we use for pulling the metrics per environment.
- jmx-groovy-scripts repo → Here we have all the groovy scripts that are being pulled in. If a metric we need is not there, we will need to add it to one of the files we are importing or create a new file and update the config repo.
- tsdb-controller repo (old metric collection) has the mappings that Grafana is currently using, you can check there to see which bean is equivalent to which Grafana metric.
Miscellaneous
- Sometimes, dashboards will be duplicated in the UI (make sure to check which one you are working on before starting your work).
You will need to delete one of them. To know which one to delete, copy the dashboard ID and try to find it within the observability repo.
If it’s not there, that’s the one that needs to be deleted from the UI.